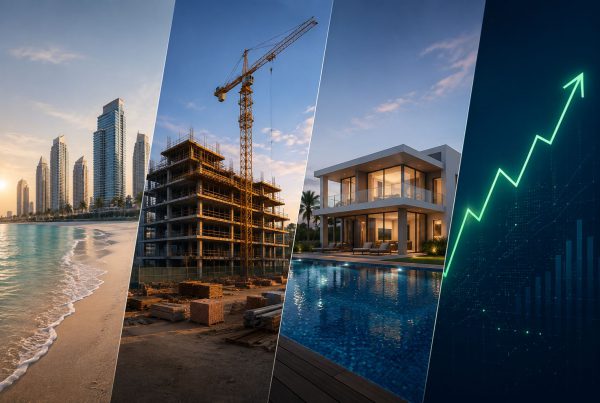
Real estate investment in the UAE continues to attract attention from across the globe, and the rental income story is a big reason why. With no personal income tax on rental earnings, a stable dollar-pegged currency, and yields that comfortably outpace most mature markets, the country presents a compelling case on paper. But the UAE is not one uniform market; it is a collection of distinct cities, each with its own risk profile, tenant demographics, and return potential.
This guide breaks down the number city by city, covering gross yields, net yields, rental growth, capital value trends, and the best-performing neighbourhoods within each emirate, so you can make a like-for-like comparison before committing capital.
How rental Yield is calculated and why it matters
Before comparing cities, it helps to understand what the figures actually measure.
Gross rental yield is the simplest metric: annual rent divided by purchase price, expressed as a percentage. It tells you the headline return before any costs are deducted. Net rental yield subtracts recurring ownership costs of service charges, management fees, maintenance, and municipal taxes and gives a more realistic picture of what an investor actually takes home.
In the UAE, the gap between gross and net is typically 1.5–2 percentage points. A property advertised at 8% gross might realistically return 6–6.5% net once expenses are accounted for.
Table 1: Gross vs estimated net rental yield by emirate (apartments, 2025)
| Emirate | Gross yield (avg) | Estimated net yield | Yield gap |
| Dubai | 6.5–7.2% | 5.0–5.7% | ~1.5 pp |
| Abu Dhabi | 6.0–6.8% | 4.5–5.3% | ~1.5–1.8 pp |
| Ras Al Khaimah | 7.0–7.8% | 5.2–6.0% | ~1.8 pp |
| Sharjah | 5.0–6.0% | 3.5–4.5% | ~1.5–2.0 pp |
| Ajman | 7.5–9.0% | 5.5–7.0% | ~2.0 pp |
| Fujairah | 7.0–9.0% | 5.0–7.0% | ~2.0 pp |
| Umm Al Quwain | 8.0–10.5% | 5.8–8.0% | ~2.0–2.5 pp |
The UAE market at a glance
The national average gross rental yield reached 5.45% in Q4 2025, a meaningful improvement from 4.87% just two quarters earlier, reflecting tightening supply and consistently strong tenant demand. Annual rent growth has been recorded across every major emirate, with some markets seeing rental income rise by more than 20% in a single year.
Table 2: UAE-wide rental market snapshot (year-end 2025)
| Metric | Figure |
| National average gross yield | 5.45% |
| Dubai apartment average gross yield | 7.2% |
| Abu Dhabi apartment gross yield | 6.78% |
| Ras Al Khaimah apartment gross yield | 7.03% |
| Sharjah apartment gross yield | 5.0–6.5% |
| Ajman apartment gross yield | 7.5–9.0% |
| Fujairah apartment gross yield | 7.0–9.0% |
| Umm Al Quwain apartment gross yield | 8.0–10.5% |
| Dubai annual rent growth (apartments) | 8.5–9.0% |
| Abu Dhabi annual rent growth (apartments) | 23.6% |
| RAK annual rent growth (apartments) | 24.7% |
| Sharjah annual rent growth (apartments) | Moderating (post 18–25% surge) |
| Ajman annual rent growth (apartments) | 9.0–9.3% |
| Fujairah annual rent growth (apartments) | 7.0–9.0% |
| Umm Al Quwain annual rent growth (apartments) | 6.0–8.0% |
| Typical gross-to-net yield gap | 1.5–2.5 pp |
Dubai Rental Yields by Neighbourhood
Dubai is the most liquid, most researched, and most internationally traded property market in the region. Its appeal rests on a deep pool of international tenants, a well-established legal framework for property ownership, and a track record of strong long-term capital appreciation.
Average apartment yields sit around 7.2%, with villa yields lower at approximately 4.9%. The variation between neighbourhoods is wide. Budget-friendly areas such as Jumeirah Village Circle, International City, and Arjan routinely deliver yields in the 8% range, while established luxury addresses like Downtown Dubai and Dubai Marina yield closer to 5–6% gross, with the value proposition there tilting more toward capital growth than income.
Apartment size also matters. Studios and one-bedroom units consistently outperform yield across Dubai because purchase prices are proportionally lower while rental demand for compact units remains strong among the city’s large expatriate workforce.
Table 3: Dubai rental yields by neighbourhood (apartments, 2025)
| Neighbourhood | Property type | Gross yield range | Market tier |
| Jumeirah Village Circle | Apartments | 7.5–8.5% | Mid-range |
| International City | Apartments | 8.0–9.0% | Budget |
| Dubai Silicon Oasis | Apartments | 7.0–8.0% | Mid-range |
| Al Furjan | Apartments | 7.0–7.5% | Mid-range |
| Dubai Marina | Apartments | 5.5–6.5% | Premium |
| Downtown Dubai | Apartments | 5.0–6.0% | Luxury |
| Palm Jumeirah | Villas | 4.5–5.5% | Ultra-luxury |
| Arabian Ranches | Villas | 4.0–5.0% | Premium villa |
Table 4: Dubai yield by bedroom type (apartments, 2025)
| Bedroom type | Gross yield range | Best-performing areas |
| Studio | 7.5–9.0% | International City, DSO, JVC |
| 1-bedroom | 7.0–8.0% | JVC, Al Furjan, Business Bay |
| 2-bedroom | 6.0–7.0% | Dubai Marina, JVC, Business Bay |
| 3-bedroom | 5.0–6.0% | Dubai Hills, Palm Jumeirah |
| Villa (all sizes) | 4.0–5.5% | Damac Hills, Arabian Ranches |
| Buy Property in Dubai | Properties for Sale in Dubai |
| Buy Apartment in Dubai | Apartment for Sale in Dubai |
| Buy Villa in Dubai | Villa for Sale in Dubai |
Abu Dhabi Rental Yields by Neighbourhood
The capital offers a different investment proposition. Yields are slightly lower on average than Dubai’s, but the market is characterised by less price volatility, steadier tenant occupancy, and strong institutional-grade demand from government employees, healthcare professionals, and corporate tenants.
What made Abu Dhabi particularly notable in 2025 was the pace of rental growth. Annual apartment rental increases hit 23.6%, the highest in the country on a percentage basis, reflecting tightening supply against a backdrop of population expansion and major infrastructure investment. The sales price index for apartments rose 34.8% year-on-year, meaning investors who purchased in 2024 captured both strong income and significant capital gains.
One-bedroom apartments offer the most attractive yield profile in Abu Dhabi, outperforming studios, two-bed, and three-bed units on a gross basis.
Table 5: Abu Dhabi rental yields by bedroom type (apartments, 2025–26)
| Bedroom type | Gross yield | Notes |
| Studio | ~4.1% | Lower price-to-rent ratio in premium buildings |
| 1-bedroom | ~5.0% | Strongest yield profile in the emirate |
| 2-bedroom | ~4.5% | High demand, competitive pricing |
| 3-bedroom | ~4.2% | Strong tenant demand but higher entry cost |
| Villa (all types) | ~4.8% | Competitive with Dubai villas |
Table 6: Abu Dhabi yield by neighbourhood (apartments, 2025–26)
| Area | Yield range | Investor notes |
| Al Reem Island | 5.5–7.0% | Most liquid freehold market in Abu Dhabi |
| Yas Island | 5.5–6.5% | Tourism and entertainment demand driver |
| Saadiyat Island | 4.5–5.5% | Luxury cultural district, capital growth focus |
| Khalifa City | 5.0–6.0% | Popular with families and long-term tenants |
| Al Ghadeer | 5.5–6.5% | Affordable, high-demand commuter area |
| Buy Property in Abu Dhabi | Properties for Sale in Abu Dhabi |
| Buy Apartment in Abu Dhabi | Apartment for Sale in Abu Dhabi |
| Buy Villa in Abu Dhabi | Villa for Sale in Abu Dhabi |
Ras Al Khaimah Rental Yields by Neighbourhood
RAK has attracted significant attention over the past two years, and the data backs up the hype. Apartment rental yields averaged 7.03% at year-end 2025, with specific pockets delivering far higher. Yasmin Village, a popular residential area among working professionals, recorded apartment yields exceeding 12% among the highest in the entire Gulf region.
The broader investment thesis for RAK centres on two intersecting forces: the Wynn Al Marjan Island resort, a $3.9 billion integrated resort scheduled to open in 2027, and a surge in free zone business registrations that is steadily growing the emirate’s resident population. Both factors point toward sustained rental demand in the years ahead.
Property entry prices remain significantly more affordable than Dubai or Abu Dhabi, lowering the capital barrier and improving relative returns for investors working with smaller budgets.
Table 7: Ras Al Khaimah rental yields by area (2025)
| Area | Property type | Gross yield | Yield driver |
| Yasmin Village | Apartments | 11.0–12.0% | High occupancy, affordable rents |
| Al Hamra Village | Apartments | 5.5–5.8% | Freehold community, tourism demand |
| Al Marjan Island | Apartments | 5.5–6.0% | Wynn resort proximity |
| Shamal Julphar | Villas | 6.0–6.4% | Limited supply, strong family demand |
| Julfar | Villas | 5.5–6.0% | Established residential area |
| Mina Al Arab | Apartments | 6.0–7.0% | Waterfront, growing tenant base |
| Buy Property in Ras Al Khaimah | Properties for Sale in Ras Al Khaimah |
| Buy Apartment in Ras Al Khaimah | Apartment for Sale in Ras Al Khaimah |
| Buy Villa in Ras Al Khaimah | Villa for Sale in Ras Al Khaimah |
Sharjah Rental Yields by Neighbourhood
Sharjah’s investment case is built on proximity rather than standalone yield strength. Sharing a border with Dubai and connected by major road infrastructure, the emirate absorbs a significant portion of workers priced out of Dubai’s rental market. This gives Sharjah consistent occupancy rates and a reliable, budget-conscious tenant pool.
Rental yields in the emirate generally fall between 5% and 6.5% for apartments. After sharp rent increases through the first half of 2025, the market entered a stabilisation phase in the second half of the year, with price growth moderating without any significant correction. That kind of moderation demand-led rather than speculative is generally considered a healthy sign for long-term investors.
Table 8: Sharjah rental yield by area (apartments, 2025)
| Area | Average annual rent (AED) | Yield range | Notes |
| Al Khan | ~61,700 | 5.5–6.5% | Premium waterfront, highest rents |
| Al Majaz | ~45,000 | 5.5–6.0% | Central, well-connected |
| Al Nahda | ~38,000 | 5.8–6.5% | High Dubai worker demand |
| Al Qasimia | ~35,700 | 6.0–7.0% | Most affordable, strong occupancy |
| Muwaileh | ~40,000 | 5.5–6.0% | Growing family area near universities |
| Buy Property in Sharjah | Properties for Sale in Sharjah |
| Buy Apartment in Sharjah | Apartment for Sale in Sharjah |
| Buy Villa in Sharjah | Villa for Sale in Sharjah |
Ajman Rental Yields by Neighbourhood
Ajman is the smallest emirate covered here but delivers some of the highest raw yields in the country. Entry prices are low as a decent one-bedroom apartment can be acquired for under AED 400,000 which mechanically inflates yield percentages even at modest rental levels. Ajman Downtown has posted returns approaching 9.4% in recent reporting periods, while Al Yasmeen and Al Zorah offer more modest but still competitive returns for villa investors.
The trade-off is market depth. Liquidity is thinner, tenant selection is more limited, and capital appreciation has historically been weaker than in the larger emirates. For investors who prioritise current income over long-term asset growth and are willing to manage their property more actively, Ajman can be a high-performing niche allocation.
Table 9: Ajman rental yield by area and property type (2024–25)
| Area | Property type | Gross yield | Notes |
| Ajman Downtown | Apartments | 9.0–9.4% | Highest ROI in emirate |
| Al Nuaimiya | Apartments | 8.0–9.0% | Most active rental area |
| Al Yasmeen | Villas | 6.0–6.2% | Established villa community |
| Al Zorah | Villas | 6.8–7.0% | Eco-resort setting, growing interest |
| Al Rashidiya | Apartments | 7.5–8.5% | Affordable entry, high occupancy |
| Buy Property in Ajman | Properties for Sale in Ajman |
| Buy Apartment in Ajman | Apartment for Sale in Ajman |
| Buy Villa in Ajman | Villa for Sale in Ajman |
Umm Al Quwain Rental Yields by Neighbourhood
Umm Al Quwain is the least covered emirate in UAE property data, but it is quietly emerging as an ultra-affordable entry point for yield-focused investors. Property prices are among the lowest in the country, which mechanically pushes gross yields higher. Average apartment yields range between 8–10%, with some older stock in central areas touching double digits. The tenant base is largely made up of blue-collar workers, small business owners, and families priced out of Sharjah and Ajman. Vacancy risk is moderate but manageable given low purchase prices. Capital appreciation is minimal compared to other emirates.
| Area | Property type | Gross yield range | Notes |
| UAQ City Centre | Apartments | 9.0–10.5% | Oldest stock, highest yields |
| Al Salamah | Apartments | 8.0–9.5% | Mixed residential, steady demand |
| Al Raas | Villas | 6.0–7.5% | Waterfront, limited supply |
| New UAQ | Apartments | 7.5–9.0% | Newer builds, growing interest |
| Buy Property in Umm Al Quwain | Properties for Sale in Umm Al Quwain |
| Buy Apartment in Umm Al Quwain | Apartment for Sale in Umm Al Quwain |
| Buy Villa in Umm Al Quwain | Villa for Sale in Umm Al Quwain |
Fujairah Rental Yields by Neighbourhood
Fujairah occupies a unique position as the UAE’s only emirate on the Gulf of Oman coastline, giving it a distinct tenant and tourism profile. Rental yields for apartments average 7–9%, driven by demand from port workers, oil and gas professionals, and government employees. The Fujairah Free Zone has steadily grown the working population, underpinning occupancy rates. Beachfront and sea-view properties command premium rents, particularly in areas like Al Aqah, while the city centre offers more accessible entry prices with competitive returns.
| Area | Property type | Gross yield range | Notes |
| Fujairah City Centre | Apartments | 8.0–9.0% | Port and free zone worker demand |
| Al Aqah | Apartments/Villas | 7.0–8.5% | Beachfront, tourism and expat demand |
| Dibba | Villas | 6.5–7.5% | Scenic, growing residential appeal |
| Corniche Area | Apartments | 7.5–8.5% | Sea views, consistent occupancy |
| Qidfa | Villas | 6.0–7.0% | Quite residential, family tenants |
| Buy Property in Fujairah | Properties for Sale in Fujairah |
| Buy Apartment in Fujairah | Apartment for Sale in Fujairah |
| Buy Villa in Fujairah | Villa for Sale in Fujairah |
Cross Emirate Comparison
Table 10: Full UAE city comparison investment profile summary (2025–26)
Comparion of rental yield data from different UAE cities
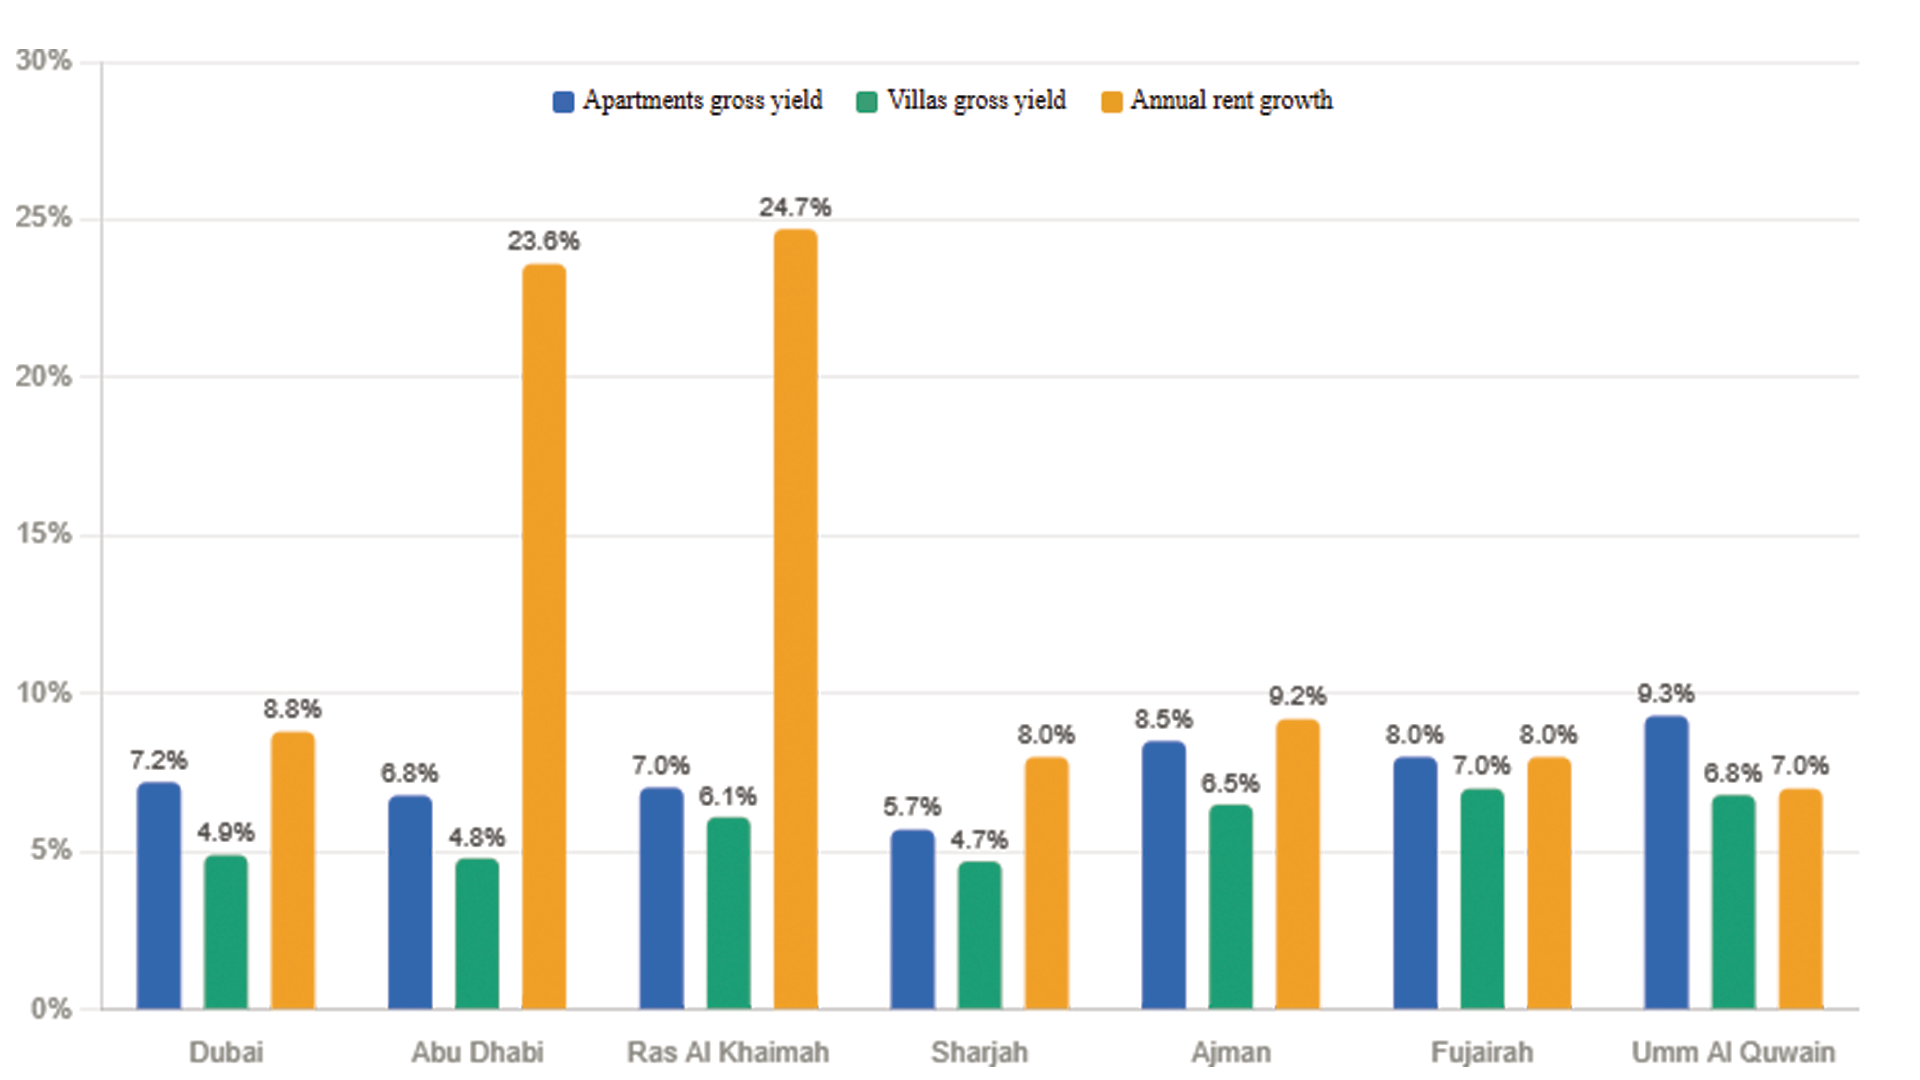
| City | Avg gross yield (apts) | Avg gross yield (villas) | Annual rent growth | YoY capital growth | Investor profile |
| Dubai | 7.2% | 4.9% | 8.5–9.0% | 12.9% | Yield + liquidity + growth |
| Abu Dhabi | 6.78% | 4.8% | 23.6% | 31.6% | Growth + stability |
| Ras Al Khaimah | 7.03% | 5.8–6.4% | 24.7% | 35%+ (select areas) | High yield + growth story |
| Sharjah | 5.0–6.5% | 4.5–5.0% | Moderating | Modest | Affordable entry |
| Ajman | 7.5–9.4% | 6.0–7.0% | Positive | Limited | Pure yield |
| Fujairah | 7.0–9.0% | 6.5–7.5% | 7.0–9.0% | Emerging | Yield + port/free zone demand |
| Umm Al Quwain | 8.0–10.5% | 6.0–7.5% | 6.0–8.0% | Minimal | Maximum yield, lowest entry cost |
Below is a visual summary of average gross yields across property types and cities:
Cost structure
Understanding gross yield is only the starting point. Several recurring costs reduce actual take-home returns, and these vary by emirate and property type.
Table 11: Typical annual ownership costs in Dubai (per unit)
| Cost item | Typical range | Notes |
| Service charge | AED 5–30 per sq ft | Varies by building quality and amenities |
| Property management fee | 8–12% of annual rent | Full-service management |
| Annual maintenance | AED 1,000–5,000 | Lower for newer builds |
| Municipality housing fee | 5% of annual rent | Paid by landlord, often passed to tenant |
| Ejari registration | AED 220 | Per tenancy contract |
| Agency fee (new tenant) | 5–7% of annual rent | One-off on new leases |
A studio in JVC with a gross yield of 8.3% typically nets around 6.5% after these costs are deducted from still a strong return, but the gap illustrates why gross figures alone can be misleading when comparing properties.
Key takeaways for investors
The UAE offers a rare combination of high-income yields, zero rental income tax, and meaningful capital appreciation for a trio that is difficult to replicate in most developed markets. The choice of emirate ultimately comes down to what each investor is optimizing for.
Investors prioritising income should look closely at Ajman and Ras Al Khaimah’s high-yield pockets like Yasmin Village, where headline gross yields regularly exceed 9–12%. Investors who want a balance of income and liquidity will find Dubai’s mid-tier neighbourhoods JVC, Silicon Oasis, and Al Furjan as the most well-rounded options. Those with a longer time horizon focused on capital growth alongside solid rental returns should look at Abu Dhabi, which posted the strongest combination of yield improvement and price growth across the UAE in 2025.
Whichever city you choose, the principles are consistent: smaller units yield more; emerging neighbourhoods yield more than established ones, and net yield after costs is always the number that matters.
Frequently Asked Question
Q1: Which areas in Dubai have the highest rental yields for apartments in 2025?
The highest-yielding apartment areas in Dubai are International City (8–9%), Jumeirah Village Circle (7.5–8.5%), and Dubai Silicon Oasis (7–8%). These mid-range and budget neighbourhoods offer strong returns because purchase prices remain relatively low while tenant demand stays consistently high due to proximity to business hubs and transport links.
Q2: Is it better to invest in Dubai or Abu Dhabi real estate for rental income?
It depends on your priority. Dubai offers higher apartment yields (7.2% gross) with better market liquidity and a wider choice of entry price points. Abu Dhabi yields slightly less (6.78% gross) but recorded stronger rental growth (23.6% vs 9%) and capital appreciation (31.6% vs 12.9%) in 2025, making it the better pick if you want income plus long-term asset growth. Dubai wins flexibility; Abu Dhabi wins overall return momentum.
Q3: What are the hidden costs that reduce rental yield on UAE investment properties?
Several recurring costs eat into gross yields by around 1.5–2 percentage points. The main ones are service charges (AED 5–30 per sq ft annually), property management fees (8–12% of annual rent), a municipality housing fee (5% of annual rent), annual maintenance (AED 1,000–5,000), and a one-off Ejari registration fee (AED 220) per tenancy. Factoring these before calculating net yield is essential to avoid overestimating actual returns.